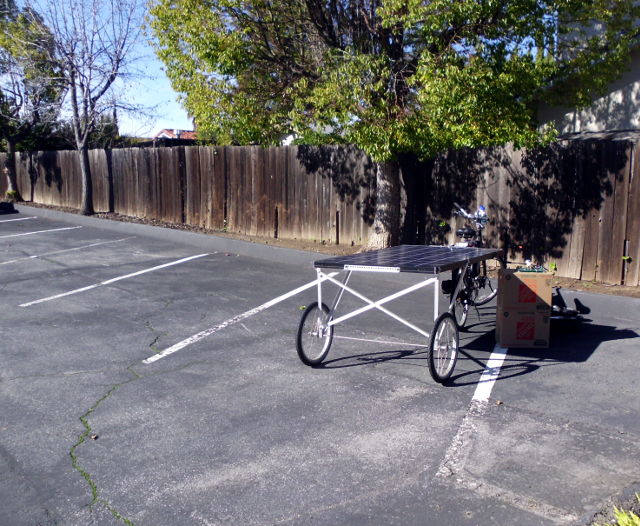
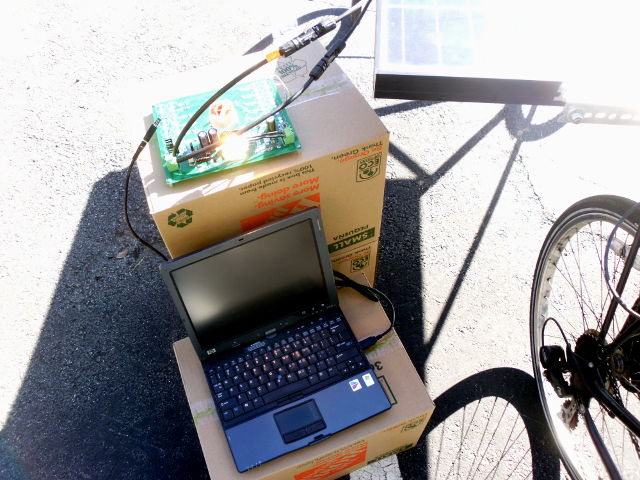
It’s Winter, and I’m thankful for all the rainy days, as California needs the water. However, that has made it hard to actually test the controller in sunlight. Wednesday was a hazy day, but at least dry, so I rushed out to do the first field test ever on the power transfer controller. This was the first time that the controller was fully powered by the solar panel.
I did not expect to get substantial power on a cloudy day with the sun at a low angle. The goal of this experiment was simply to obtain a current-voltage (I-V) curve of the panel, for later algorithm design. The curve will vary with lighting conditions and temperature, but I hoped to at least get an idea of the shape of the curve. The test program works as follows:
- The controller drives fixed-width pulses of 40 μS to the switching converter.
- The frequency of these pulses starts out at about 1 kHz (a 1024 μS period).
- The Input Voltage, Input Current, Switch Current, Output Voltage, Output Current, and Temperature are all sent out through the serial port at 4800 baud.
- As quickly as possible, the period is reduced by one step of 4 μS. Because the telemetry of step 3 is takes a long time to send, this isn’t actually so quick. The program then goes back to step 3. By changing the period in this manner, the effective load on the solar panel is altered. When the frequency reaches a maximum value of 12.5 kHz (80 μS period), the test is done.
- The next run of the software does the same thing, except with an added delay of 1000 mS each time that the period is changed.
Here is the data. The first six values graphed are raw readings; that is, untranslated A/D readings. The Input Power and Output Power were derived by multiplying the relevant voltages and currents together, then scaling into watts.
Some noise is present in the readings, which I don’t think will be a problem. There does seem to be a peak power point near the left of the graph, as expected. In fact, all the action is near the high duty-cycle region, so in actual production, when I’m seeking maximum power out, I should sweep the duty cycle over just (say) the left 20% of the graph. But something is not right. At some points near the left, the controller appears to be putting out more power than it is taking in. This is called “over-unity” or perpetual motion, and suggests a measurement error. Maybe the sensors are lagging the actual output because there is not enough settling time? I took another trace (actually 3 traces each, fast and slow), which allowed at least one full second for each sensor to settle before taking a reading.
At this time, I have more questions than answers. I’ll update this post as I know more. What is the cause of the over-unity region?
idk
Could apparent over-unity have been caused by incorrectly calculated scale factors for some sensors?
I re-checked my calculations, and they appear correct. The scale factors were not only theoretically calculated, but validated with experimental observations. Further for most of the curve, Output Power is less than Input Power, as expected.
Could apparent over-unity be due to sensors lagging true instantaneous values (sensors too slow)?
Possibly. That’s the reason why two kinds of data runs were done, one with the intent of allowing enough time for any sensors to settle. The output voltage sensor should have a time constant of about 2 mS, meaning it should settle in 10 mS at most. I’ll have to check the other sensors.
Could apparent over-unity be actual power out, but a limited duration (sensors too fast)?
On the bench, with a scope attached, voltage spikes are definitely appearing on the output. It will be cumbersome to use a scope in the field, but maybe I can change the test program to stop converting energy for a few mS, just before a reading on the output is taken. The problem could also be the noise from an overshoot when the inductor first dumps charge onto the output. Another experiment I could try is increasing the filter capacitor on the output voltage sensor. This would be unacceptable in production as it would defeat overvoltage protection, but as an experiment, it could provide insight.
Could there be an unaccounted power source on the ptc contributing power to the output?
have to think about this
Could the thermal inertia of the halogen lamp somehow be a contributor? The lamp takes several seconds to come to thermal equilibrium.
have to think about this
Could the inductance of the halogen lamp somehow be a contributor
That’s the one thing different between my dummy load and a real battery or supercapacitor. I’ll have to measure the lamp. (update: it measures about 1 μH, way too low to be a concern.) I could just attach a 12-volt lead acid battery to the output as a load, instead. It should be able to withstand the surge currents for at least a little while. If I populated the supercapacitors, they could certainly absorb the currents.
What is causing that dip in MidCurrent on the graphs?
Unlikely, but maybe it’s related to the voltage limiting comparator kicking in? That shouldn’t happen until the output voltage reaches about 24 volts, with the present setup. The output voltage sensor indicates a peak voltage of about 12 volts on the output. Maybe there are spikes going up to 24 volts? I could turn up the comparator threshold to 32 volts as an experiment.
Is the dip in MidCurrent related to the MPPT point?
It does seem to come right after the MPPT peak. If the voltage limiter is coming into play, then the MPPT point found might just be an artifact of voltage limiting kicking in? That would be great news, as it would suggest that the panel can actually put out far more energy than seen so far.
Is the dip in MidCurrent related to over-unity results?
…
Could the MidCurrent dip be related to when the synchronous rectifier starts to turn on?
…
In the region where MidCurrent dips, what are the waveforms on the gate and drain of the main switch, Q1?
It would be hard to monitor this in the field, but I could simulate it on the bench by using 24 volts of lead-acid batteries as my supply.