Last update: 29-AUG-2010
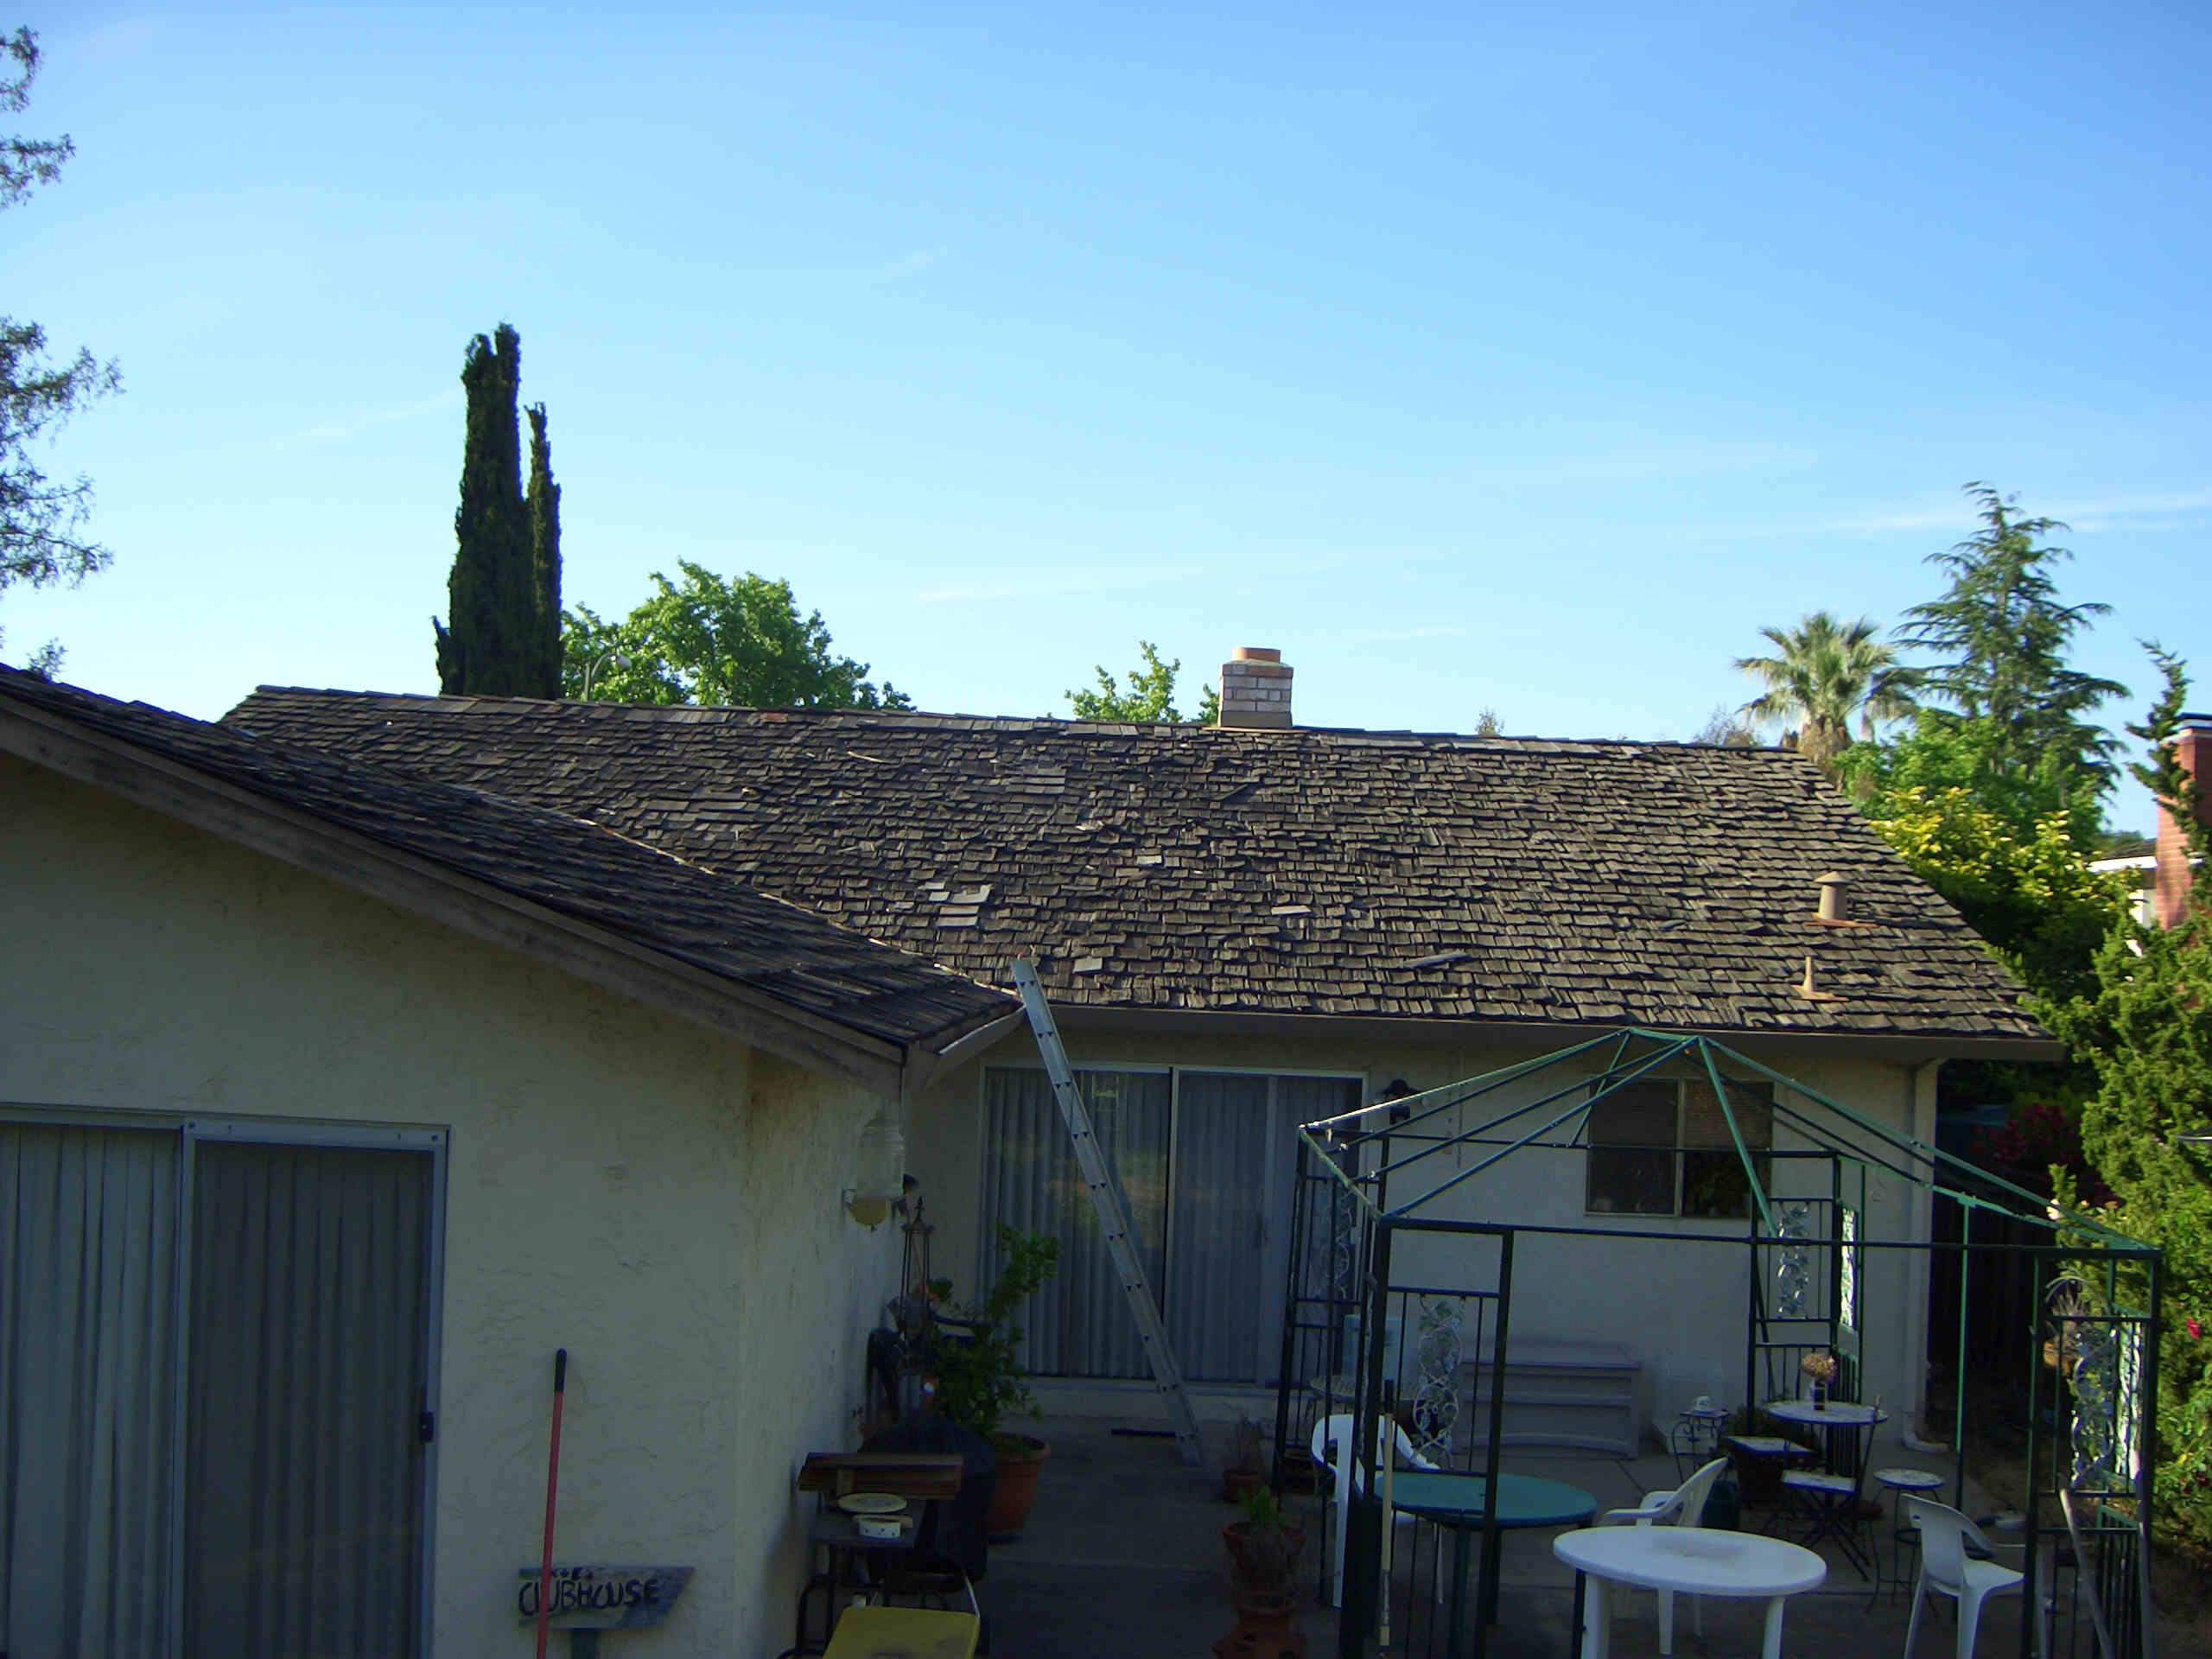
In the summer of 2006, we needed to replace our roof. Well, as long as we were going to replace the roof, I thought it would be fun to put put up photovoltaic panels at the same time.
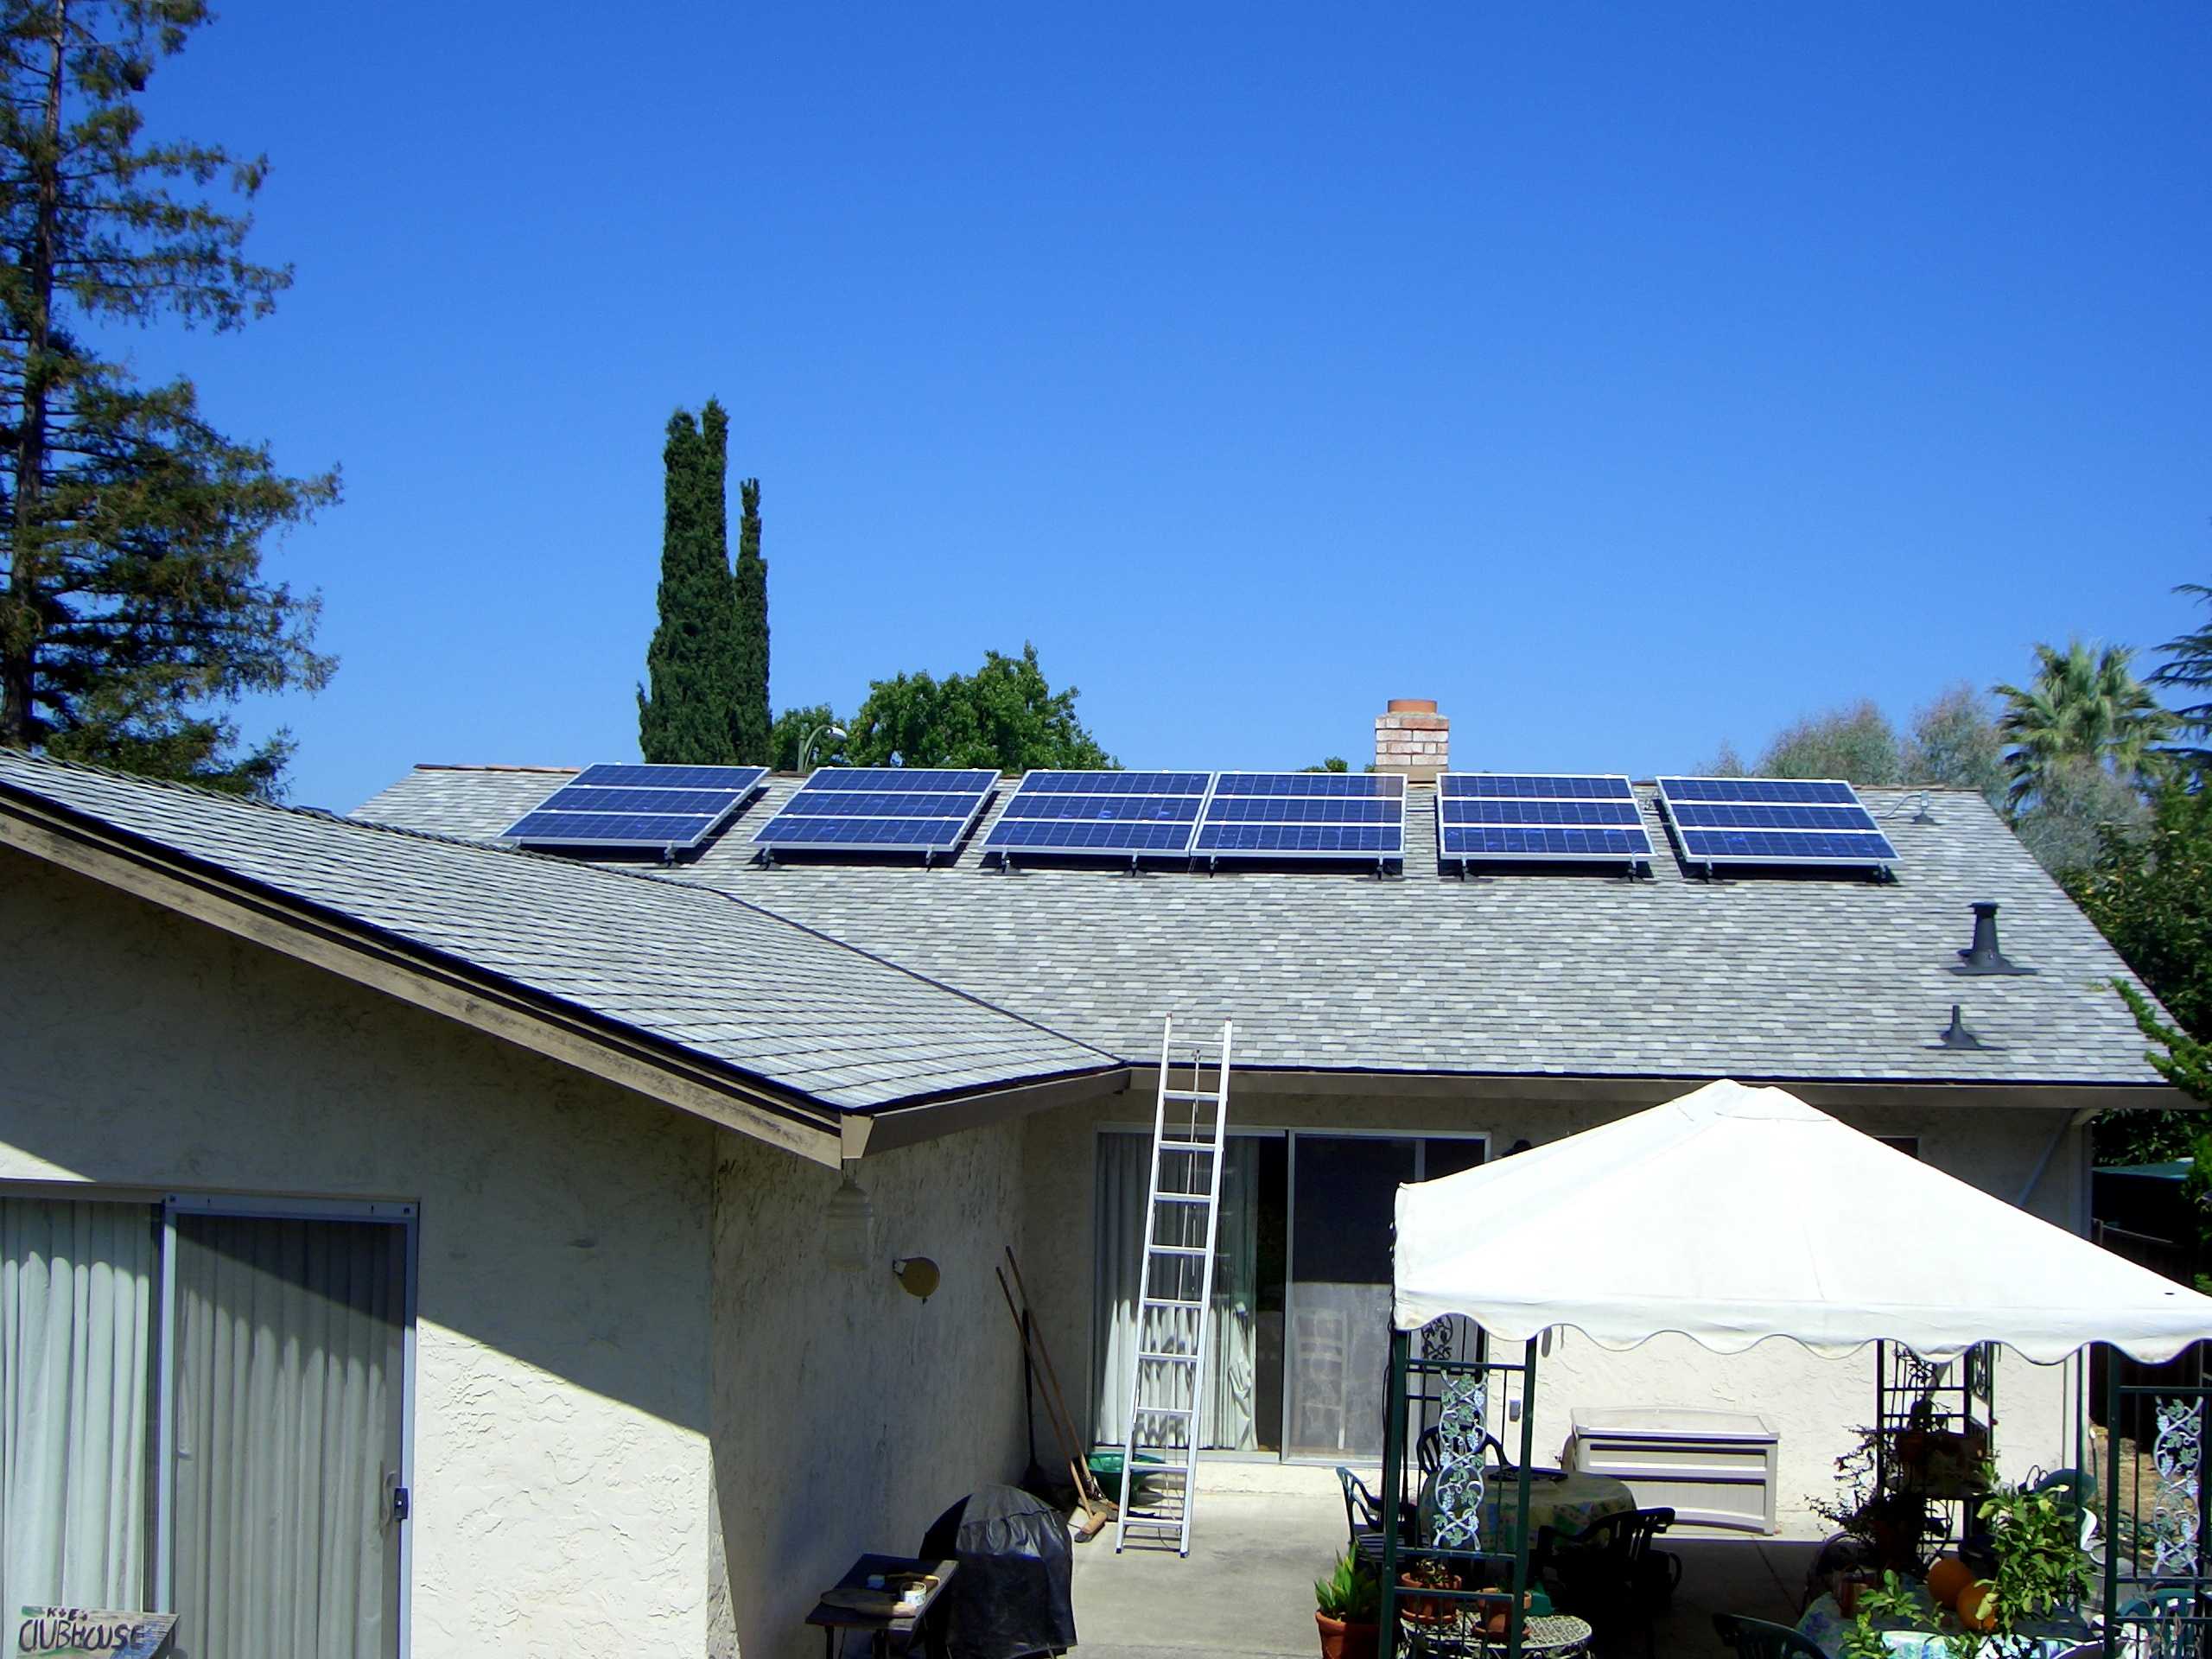
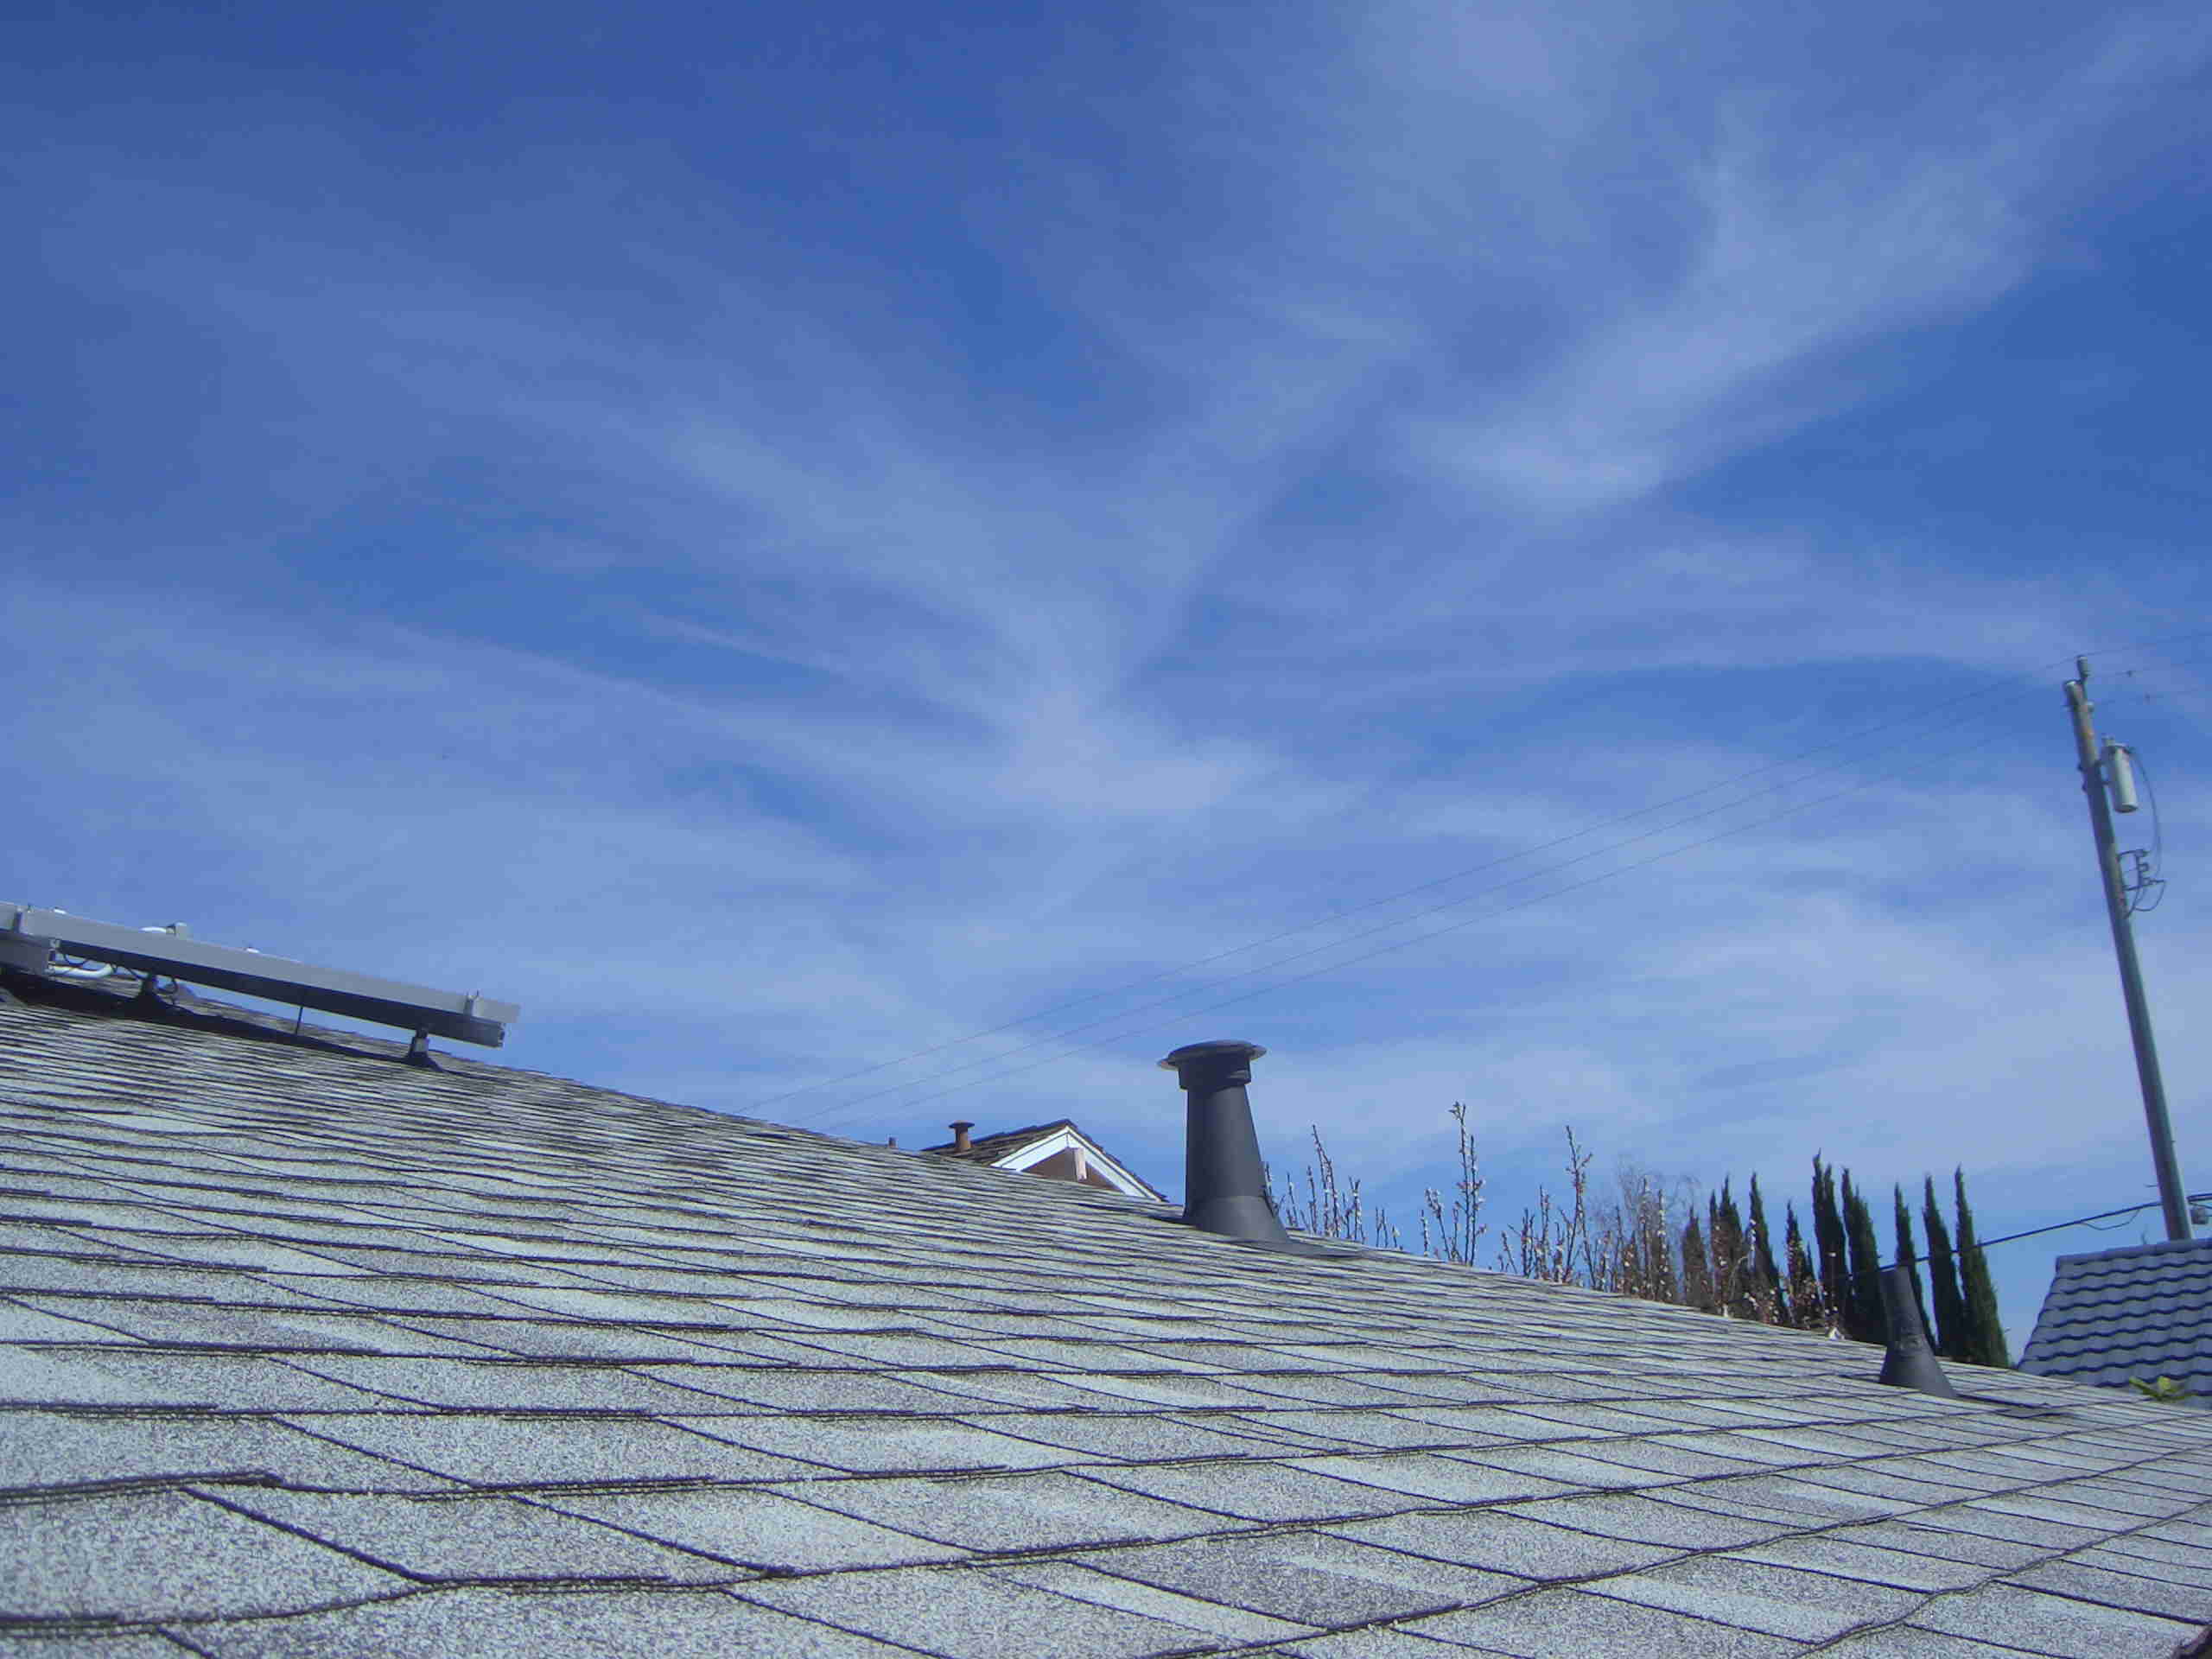
Here
is what it looks like now:
What is our location and climate?
The things that affect how much power comes out of the panels seem to be:
1. How much sun shines on them
a. Site (orientation, shading)
b. Cloud cover
c. Time of year (short days, low sun angle in the Winter)
2. The temperature (colder is better).
a. Time of year
b. Particular temperature that day
c. How much wind is blowing
So, geography matters a lot.
We live in San Jose, California, United States of America. Our latitude is 37° N, and elevation about 500 feet. In December, direct sun shines on the array from 8:00 am to 4:20 pm, on the clearest days. In June, from about 6:15 am to 7:30 pm. Snow is almost never seen. Tiny hail comes about every other year, the size of birdseed. December and January are rainy, and even if it's not raining, the sky can be overcast. In December, January, and February, frost is common, but the air temperature at dawn is usually above freezing.
In the winter, we will see fog a few days a month, but it generally burns off by 10 am. I would not call this a foggy area. On hot summer days, there is some smog from cars.
Mornings are usually dead calm, with the wind picking up to 10-15 mph in the late afternoon, coming from the North.
According to the U.S. Solar Radiation Resource Maps, our area should get the equivalent of 5 hours of full sun a day, when averaged over the year. The map only goes in 1-hour increments, though, so maybe we're really at 5.5 hours?
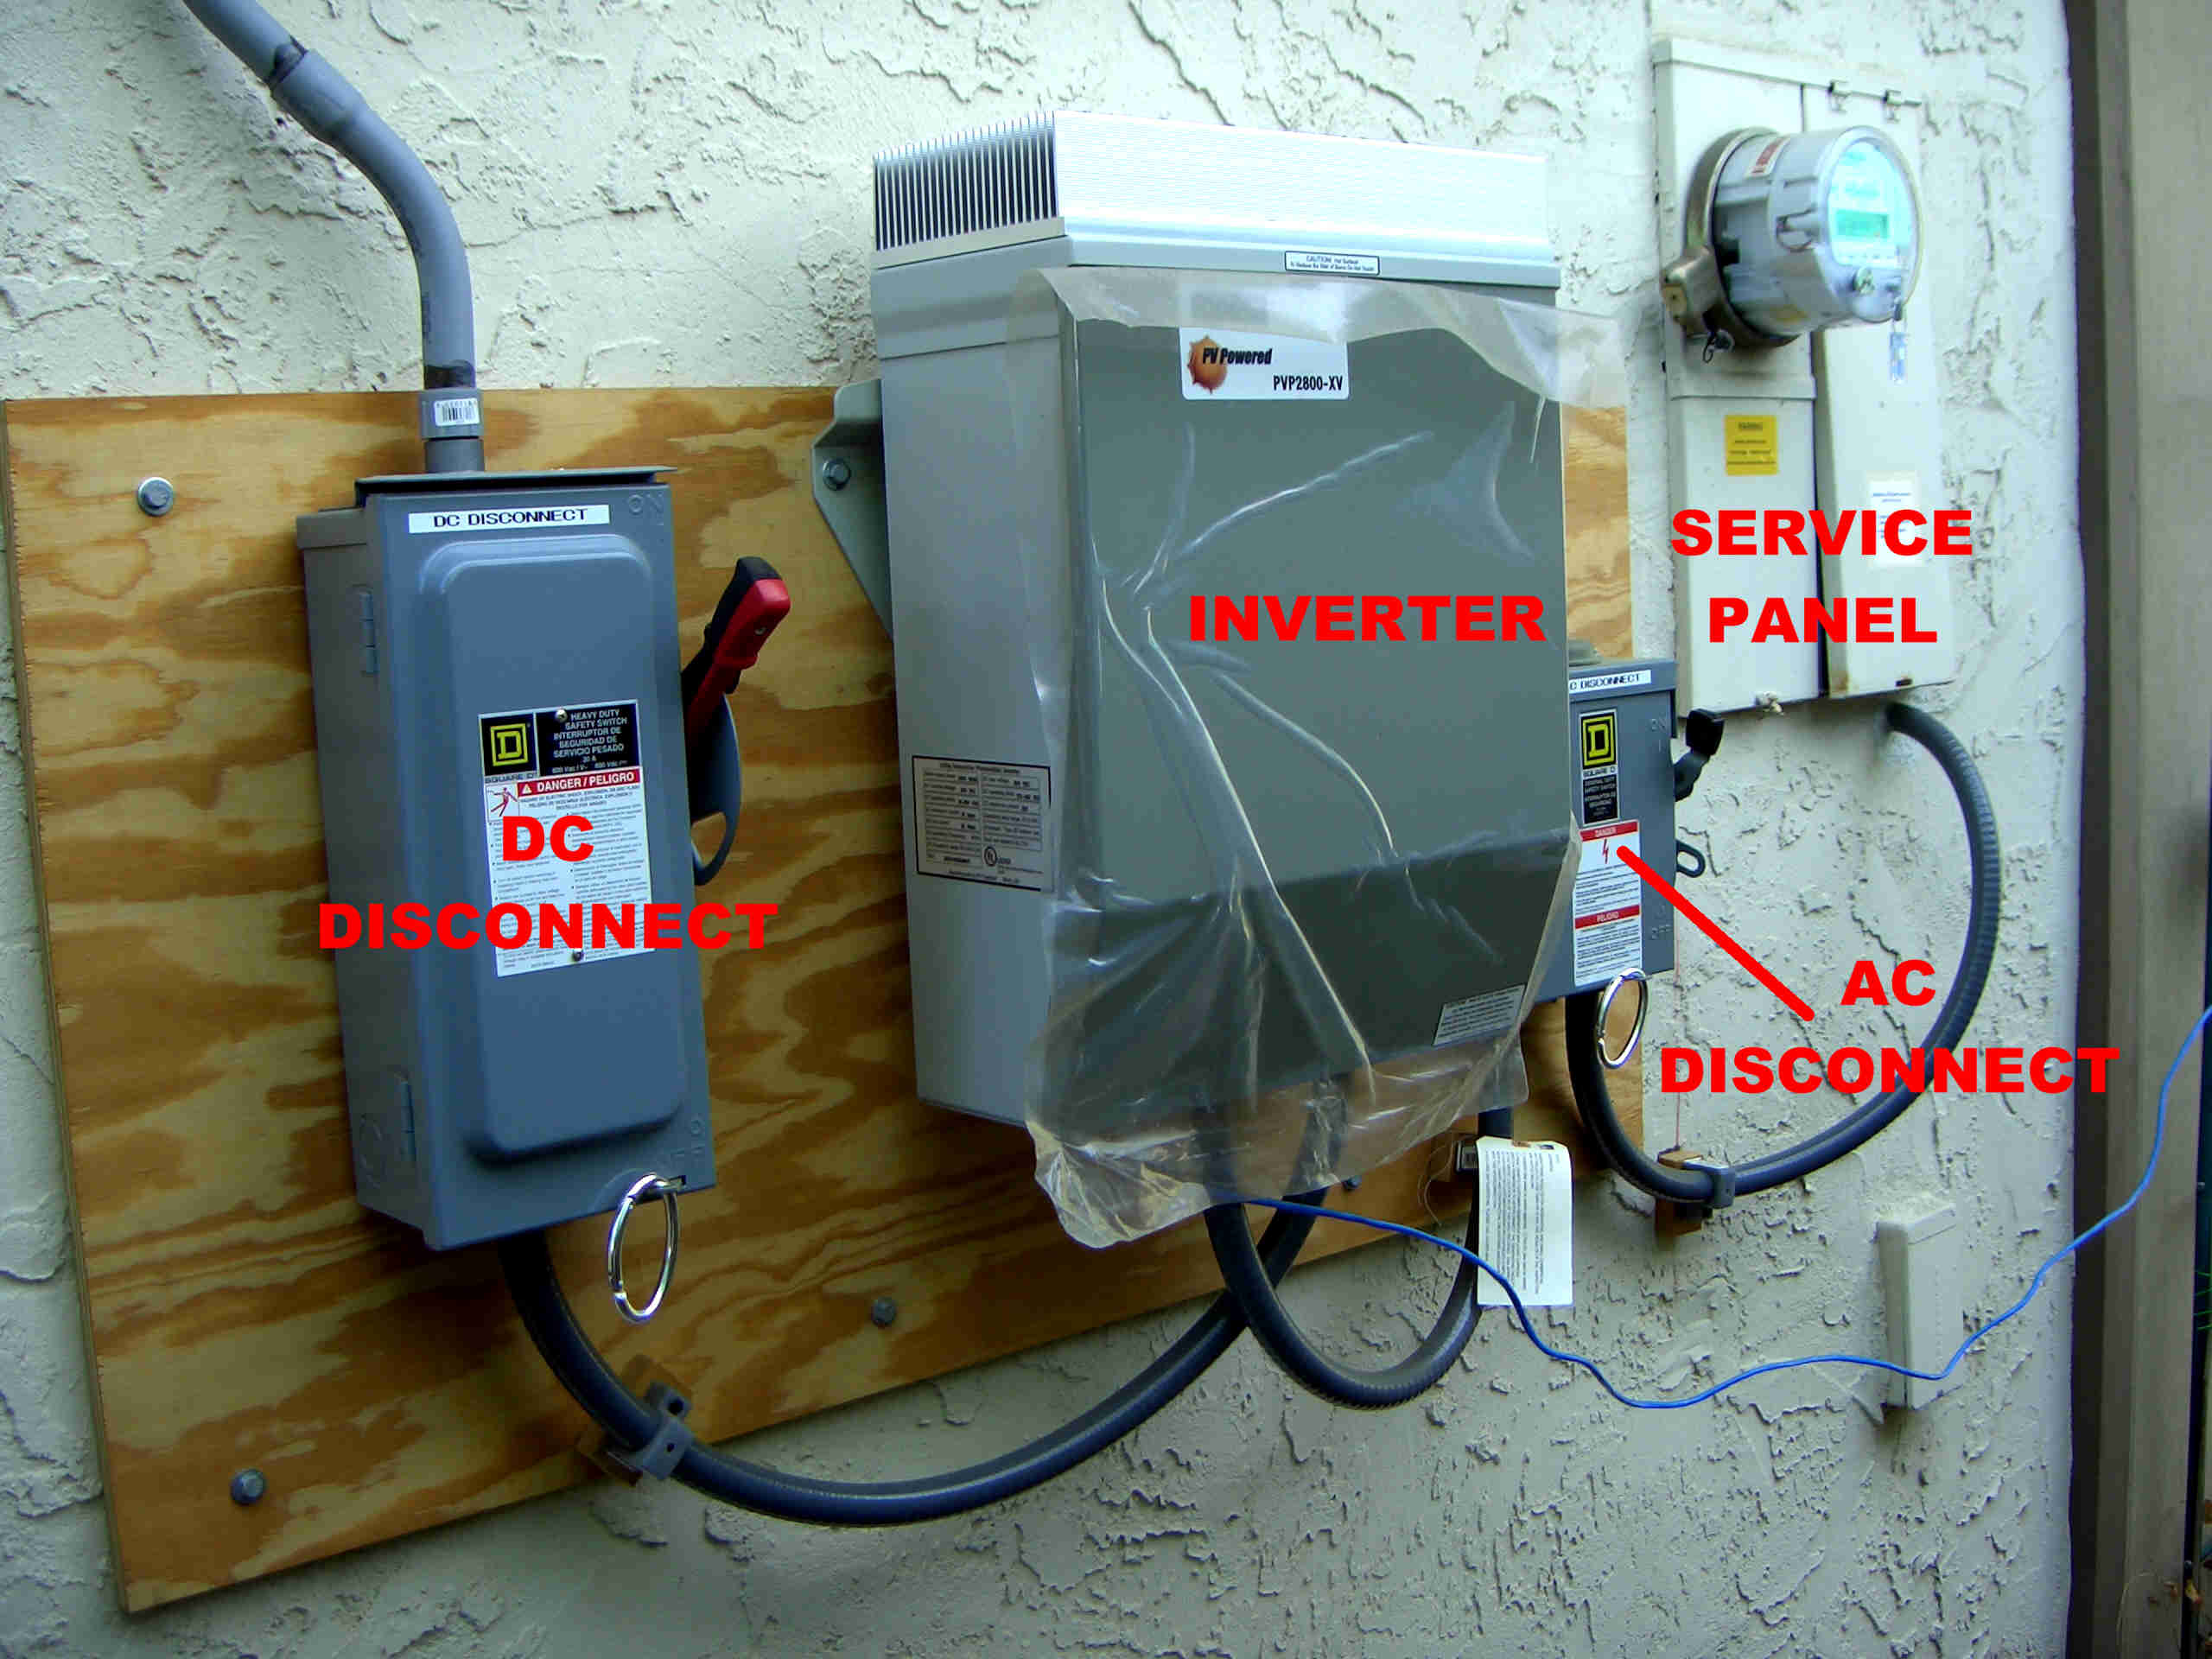
What Components Did We Use?
Modules: 18 x Mitsubishi PV-MF165EB3, in 2 parallel strings of 9
Inverter: PV Powered PVP2800-XV, grid-tied, rated for 2.8 kW, 94.5% weighted PTC efficiency
Disconnect switches: Square-D HU361RB and D321RB
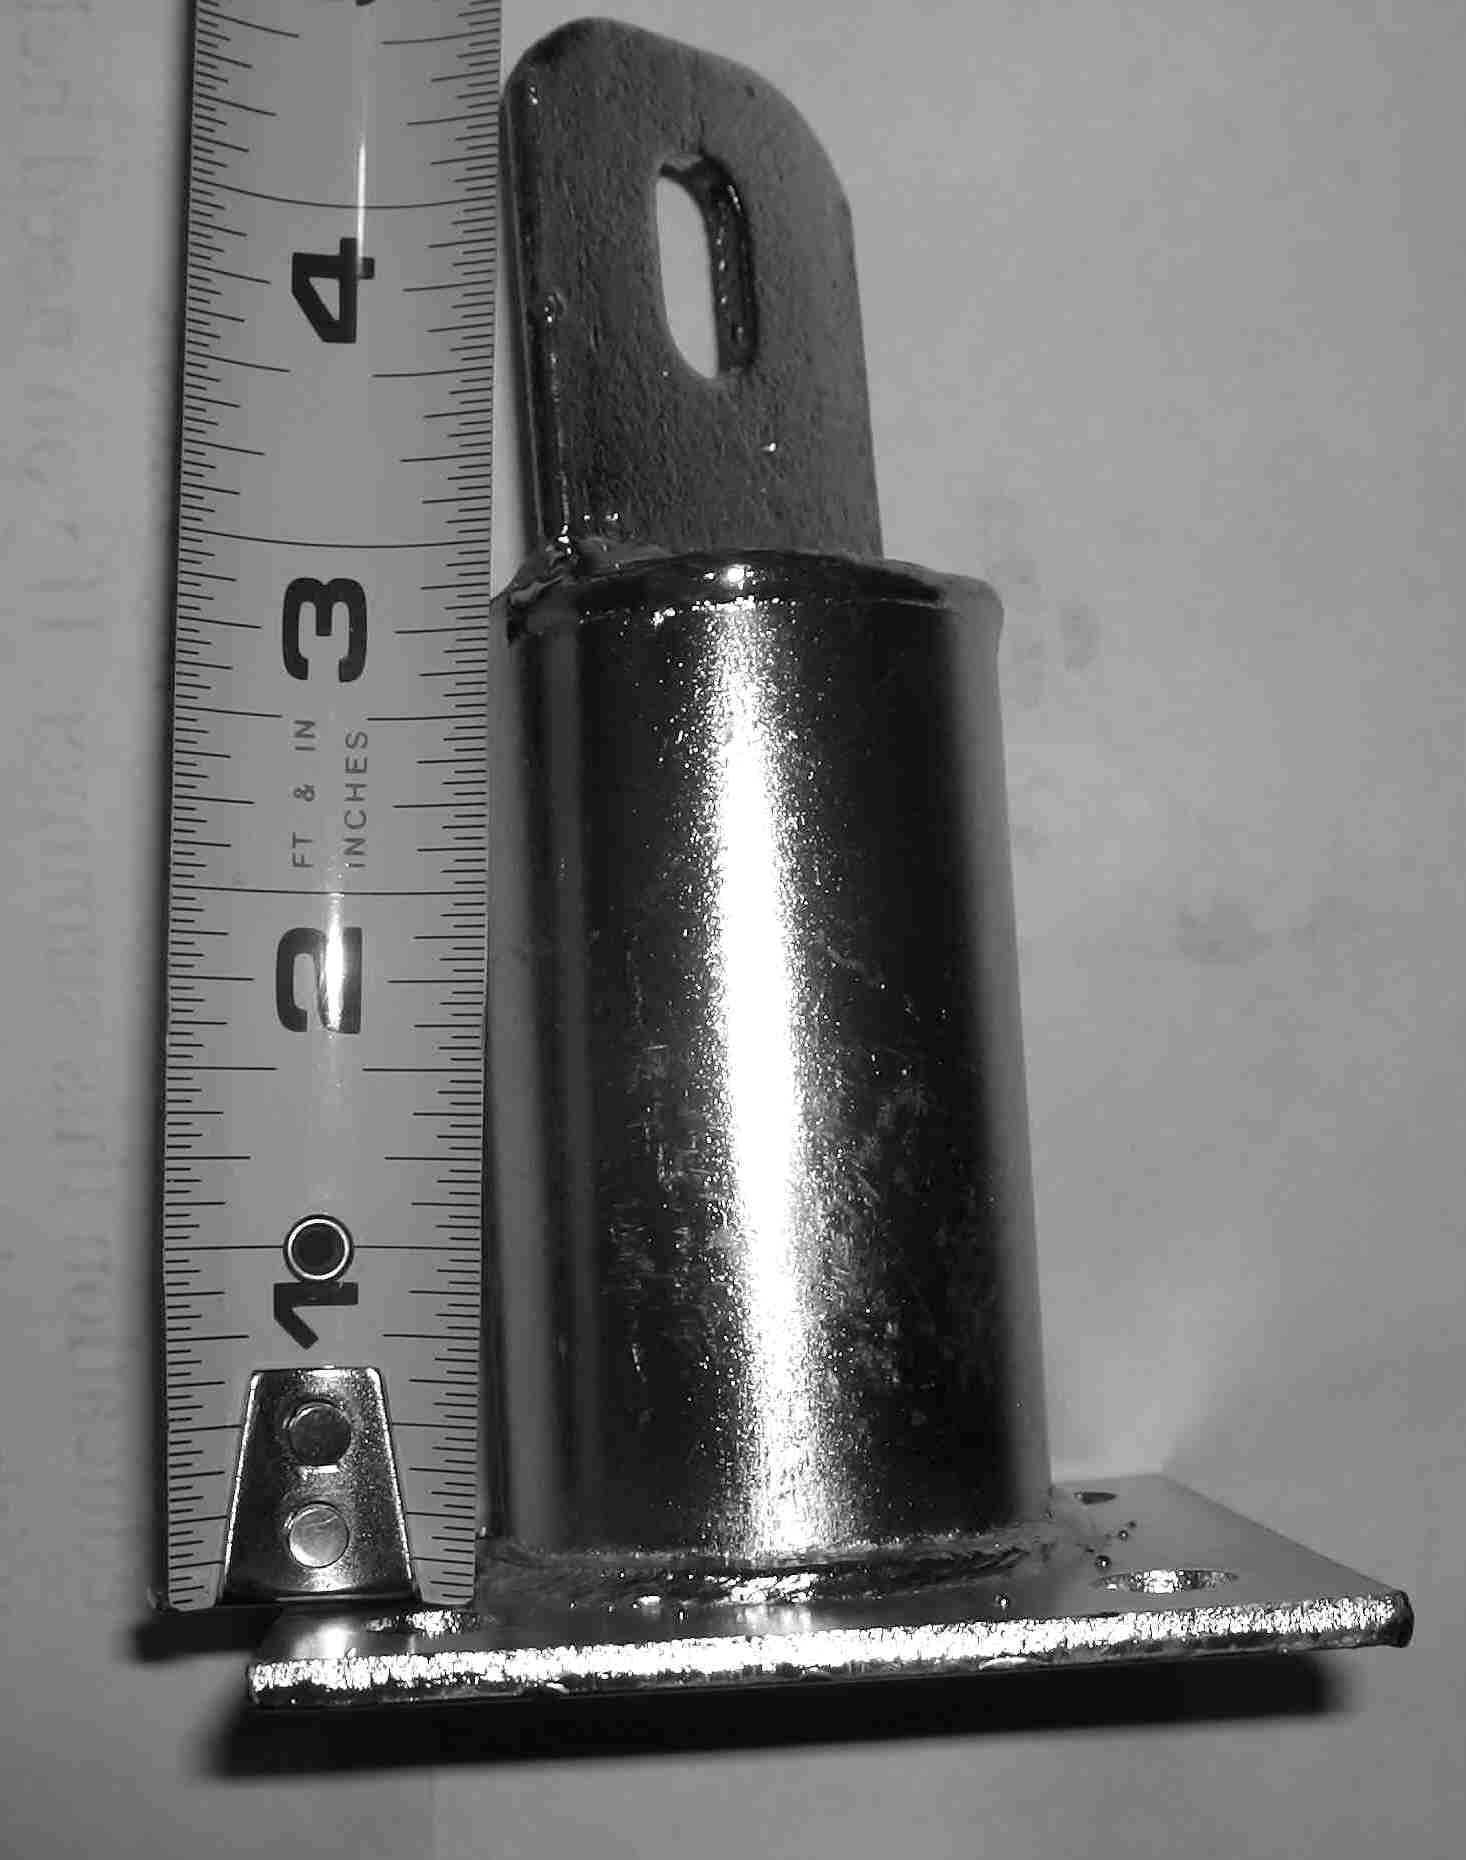
Mounting system: Unirac Solarmount racks, with 3-inch standoffs.
Roof pitch: 3/12 (15 degrees)
Array orientation: due South
Operating voltage of array: consistently 200 volts, except about 240 volts right at sunrise in the winter
System went on-line: September 15th, 2006.
Photovoltaic panels are given an STC (“Standard Test Conditions”) rating by the manufacturer. These ratings are optimistic for most real-world applications. California has a more realistic PTC rating. Our panels have an STC rating of 165 watts each, and we have 18 of them, so technically, our array is sized at 2,970 watts (2.97 kW). The PTC rating is 2.499 kW, including allowance for conversion efficiency of the inverter.
How Much Energy Does It Put Out?
May 5th (Cinco de Mayo) in 2007 was our record-setting day with 26 kWh produced. This is equivalent to the PTC rating of the array under full sun for about 10 hours. This record has since been tied several times. Our worst day was December 24th, 2006, a dark, overcast, rainy Christmas Eve which generated less than 1 kWh. But the short day had less of an effect than might be supposed. On December 22nd, just one day off the Winter Solstice, we got 16 kWh under clear skies (equivalent to 23 kWh if the array was tilted optimally for Winter).
For the first year, I would go outside every morning to take a reading, rain or shine. During this time, I had a better feel for the weather than any other time in my life. I would notice the cloud cover, the temperature, how hard the wind was blowing – having PV really makes one acutely aware of such things. We now have a PDA automatically taking the readings (read about it here). I kind of miss being so in touch with the environment.
Here is the average production per day for the first year. January had unusually low rain, demonstrating what is possible in the winter if there are no clouds.
And for you data lovers, here are the individual days. Can you tell where the rainy days are?
In the summer the days are longer, and the sun more direct. On the other hand, hot temperatures make the array less efficient. In August, we're seeing a peak power of the PTC rating minus 15%, and a typical day produces about 22 kWh. When the temperature hit 100 degrees F, we saw a peak power of PTC minus 25%. On summer days, it seems that the total energy out for the day tracks the peak power very nicely. For example, if we see the inverter putting out 2500 watts at solar noon, and get 25 kWh for the day, if on another day, we see 1900 watts at noon, we may expect 19 kWh for the day. In fact, we should be able to predict the energy out for the day by 10 am, by which time it's clear how hot it's going to get. Because of the consistent clarity of the sky in summer, the energy per day is very reliable, as opposed to spring, where it might be 26 kWh one day, but 10 kWh the next.
We just passed our first full year of operation! The total energy out of the array was 6556 kWh for the year. This is far better than the 4500 kWh that was predicted. Let's do some math. That's 6556 / 365.25 = 17.94 kWh per day average. Dividing by the PTC power of the array, 17.94 / 2.49 = 7.2 peak sun-hours per day on average. This doesn't make sense, so I conclude that I must have been sold panels that are better than advertised. (Aw shucks!) Also, it doesn't hurt that the installation is remarkably well-cooled (sitting off the roof in separate racks, rather than a monolithic block), that the roof is pointed due south, and I used larger gauge wire than required.
How Much Did It Cost?
We bought the bulk of the parts in May, 2006. The gross cost for everything, including tax and shipping, was $19989.21. By far, the dominant cost was the photovoltaic modules themselves. We shopped carefully for other parts, but there was not much to be saved, there. After the modules, inverter, and mounting racks, the remaining costs were only a few hundred dollars – small, compared to the total cost of the system.
The State of California gave us a rebate of $5947.10. If we had not self-installed our system, the State rebate would have been almost $7000. However, the increased rebate would not have covered the installation cost. Below, in relative size to the pie above, is about how much a professional installation would have cost.
We also got back $2000.00 from the US Government, who rebates 30% of the net cost of the system, with a cap of $2000 for residential installations. If there was no cap, we would have gotten back more like $4200. Below in relative scale to the pie, is the amount of money we got back as rebates (about 40%).
The bottom line is that the net cost of our system was $12042.11, or $4.11 per STC watt, installed, for people who think that way.
In terms of electric costs saved, the system is unlikely to pay for itself in 20 years. That's because our electric usage was already low, in the inexpensive baseline tier.
However, a photovoltaic system could add value to our house. I've heard the guide of taking the energy cost saved per year, and multiplying it by 20 to get a present capital value. Ironically, this comes out to about $12000 – more, if someone normally uses electricity into the higher tiers. By this reasoning, the system may have already paid for itself. But since housing prices go up and down, we'll never really know how much, if anything, the system added to the value of our house.
Update 3/2009: Prices have fallen, and Federal tax credits risen, since we installed our system. It's cheaper today, in other words. I don't regret doing it when we did. I cashed in stock to get the funds for building, stock which would have been worth much less today.
Solar hot water pays back much better.
Other Interesting Information
In actual work time, I'd guess it took 4 long days to put everything up. A professional would no doubt have been much faster. In real time, the project from start to finish took about 3 months. Having no particular deadline probably saved some money, as I was able to wait for good deals on eBay. It was also a pleasant experience not having to rush. We even took a vacation in the middle of the project.
Roughly speaking, 50% of the energy on a given day is generated by 12 noon (or 1 pm, Daylight Time). This means that I can look at the production at lunchtime, and predict the output for the whole day.
Hazy days have very little effect on energy output.
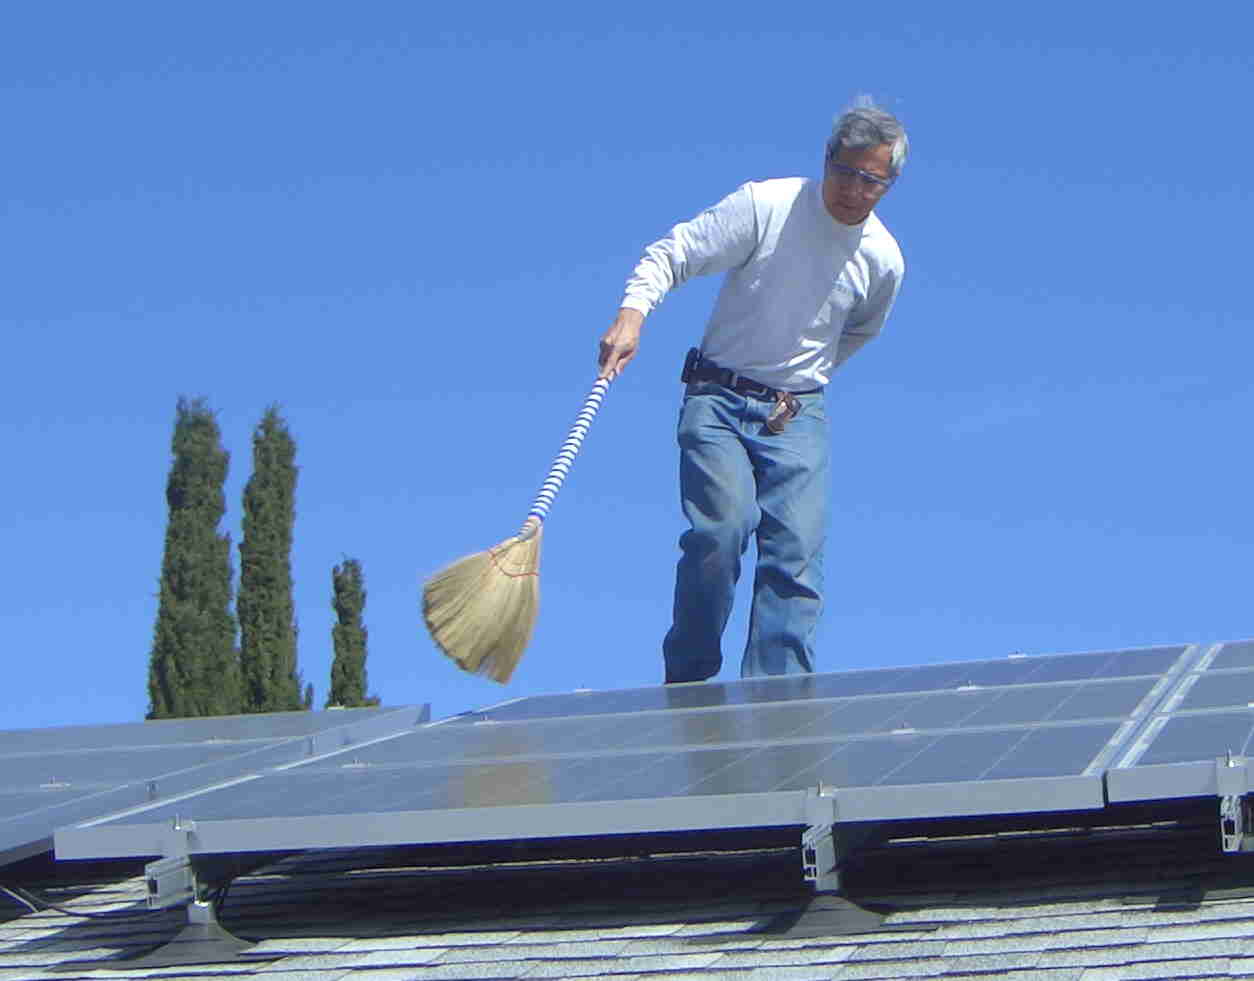
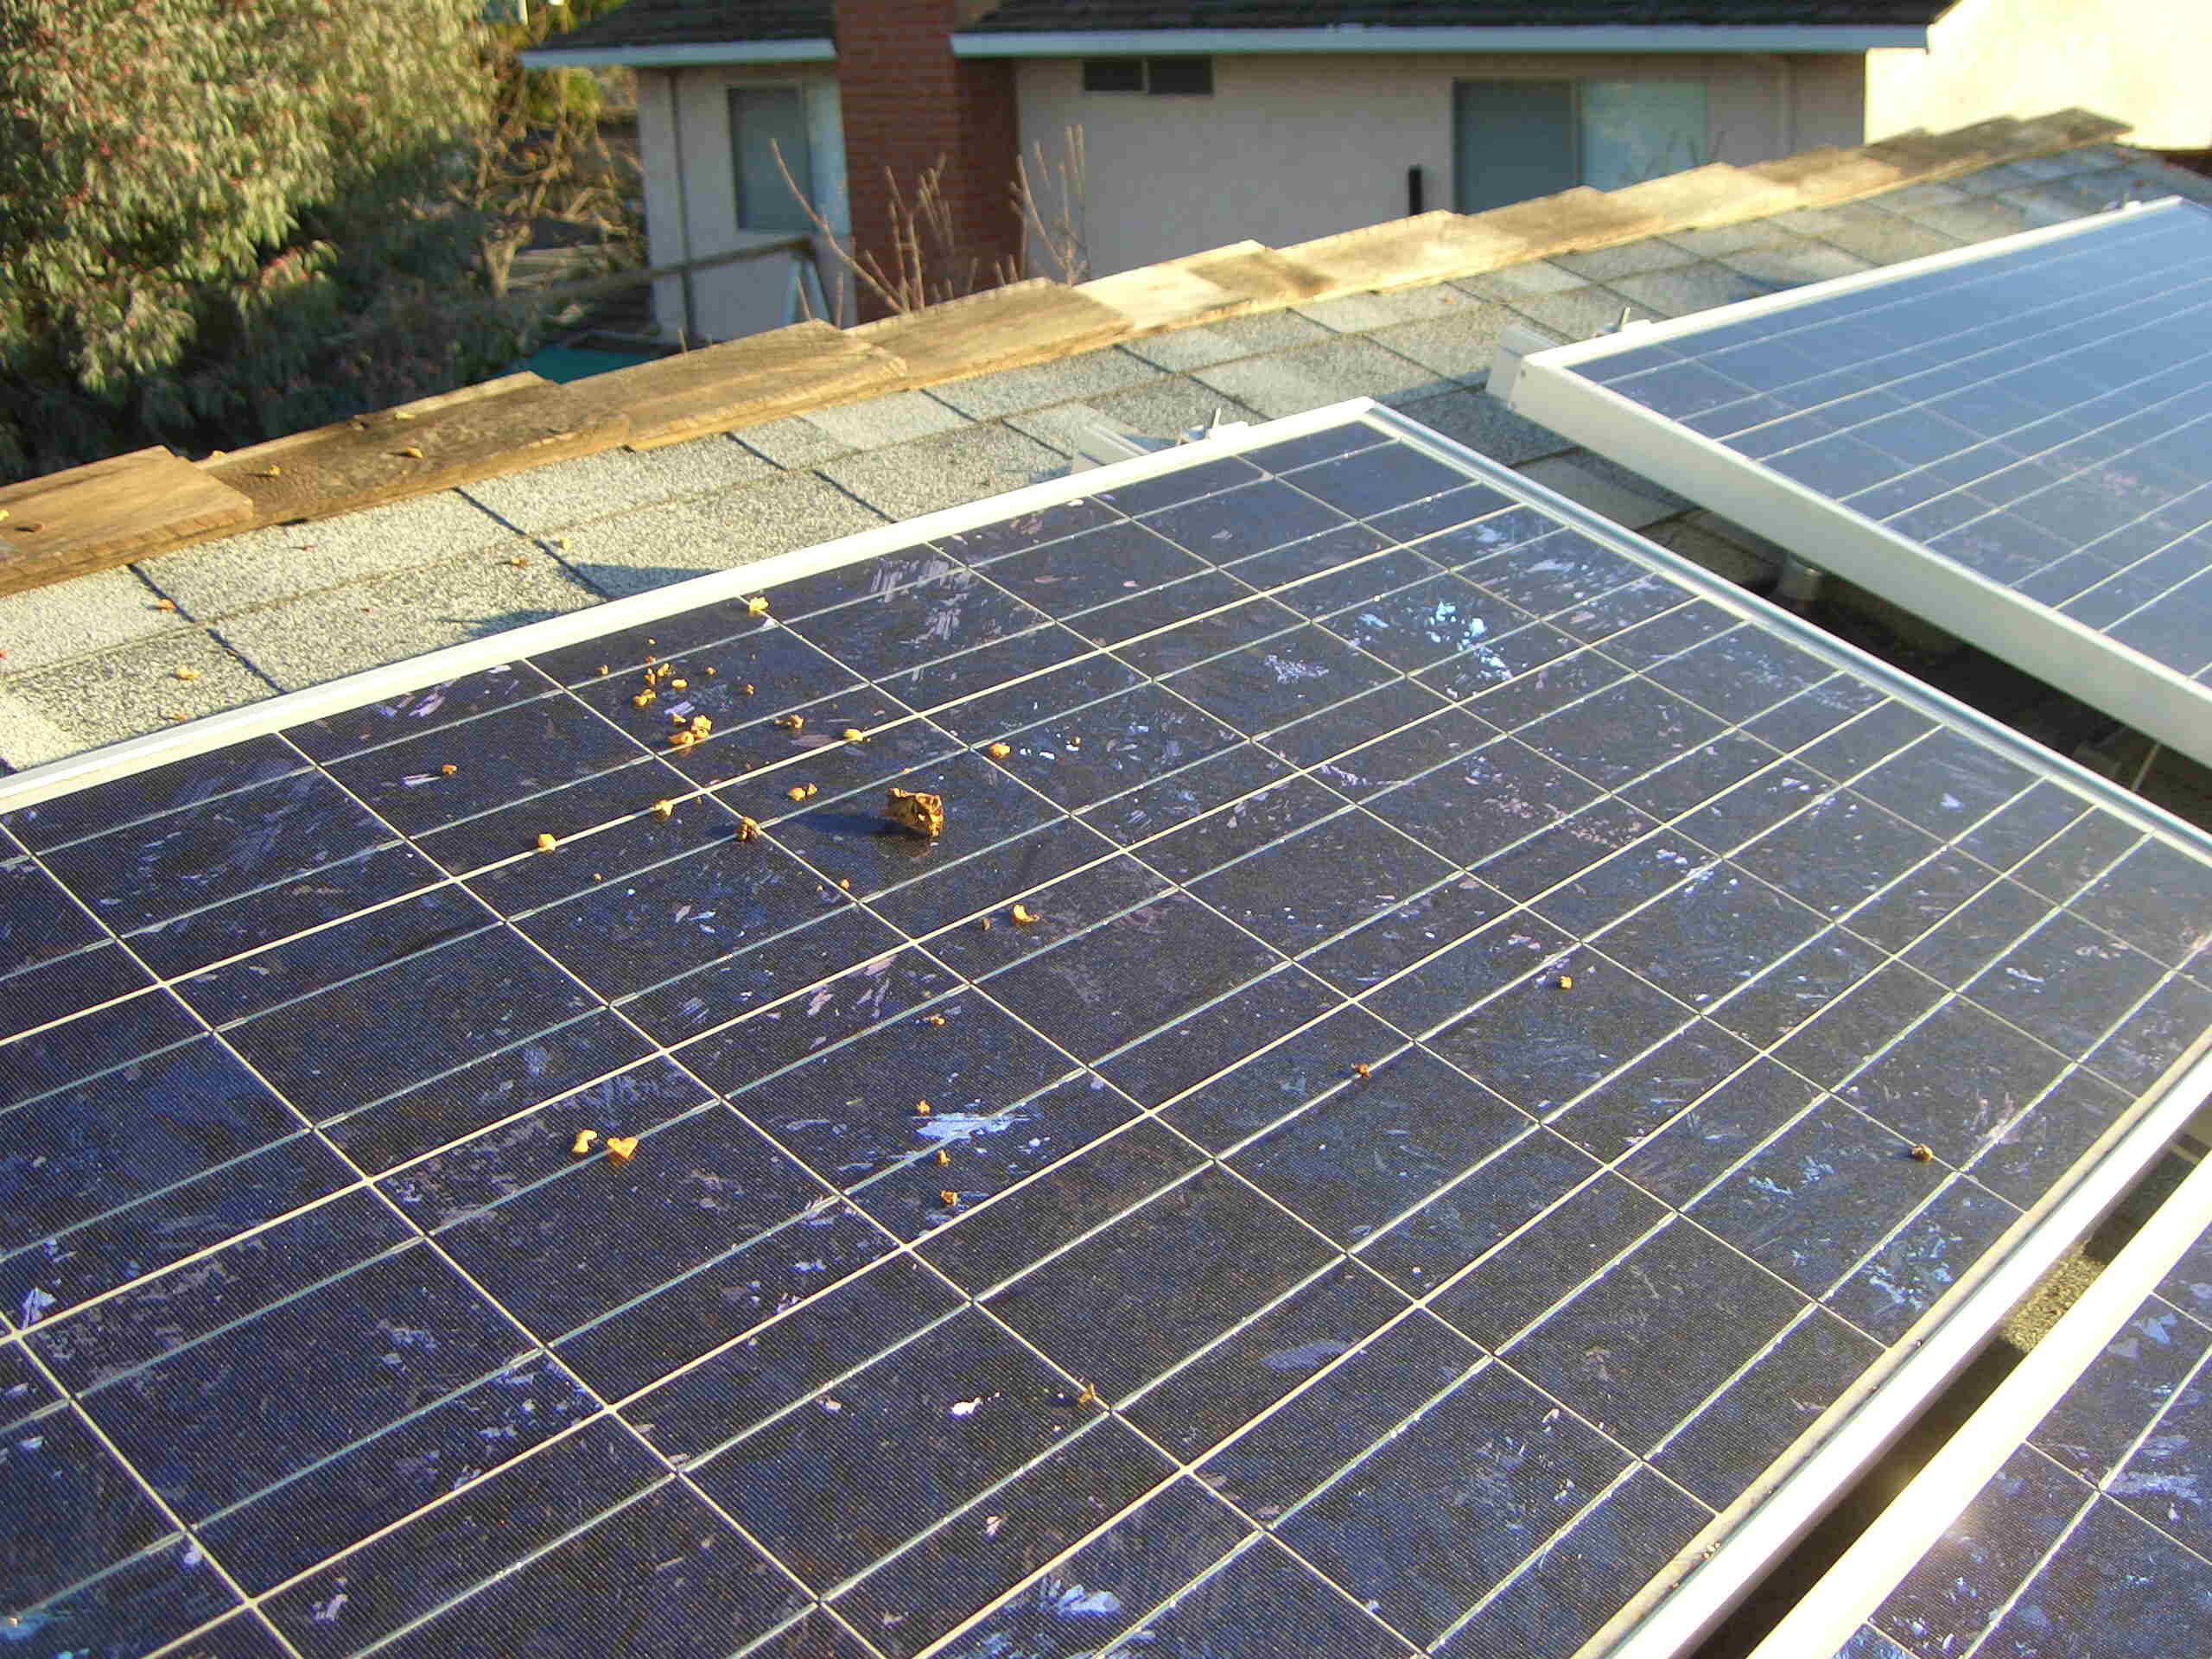
Is cleaning required? There is a thin layer of dust that accumulates on the array, but it never seems to get very bad. Perhaps the morning dew washes it off. I tried washing the dust layer off, but it didn't seem to make a difference as far as the energy output. The only time I need to actually clean the panels is during apple season. Squirrels leave their refuse all over, as in the picture below. Bird droppings don't seem to be a problem for some reason.
It would have been better to use 6-inch or higher standoffs for the panel mounting racks. The panels would have run cooler because of better airflow, and possibly put out a little more energy. Also, longer standoffs would have been easier for the roofer to flash.
The inverter works decently at converting the DC electricity of the solar panels to AC for the house. However, the one we have is a first-generation model, and difficult to monitor by computer. If I had to do it over again, I'd make sure I bought an inverter that was easy to monitor.
More Information
The best place I have found to ask questions about photovoltaic systems is the Northern Arizona Wind & Sun Forum. The people there are of a much higher caliber than you will find on a general usenet forum like alt.solar.photovoltaic.
For information on best electrical practices, see NMSU Institute for Energy & the Environment. If the link doesn't work just Google “John Wiles Photovoltaic” and it should come up.
The plans and some other miscellaneous materials from the project are HERE. The .odg files are OpenOffice draw (editable).
A
home-movie documentary
of our whole project can be found
HERE.
Some thumbnails are below.
If
you have a Solar Electric system (or Solar Thermal), we'd love to
hear from you. What was your experience like? Even if you don't have
a system, we'd still love to hear from you. Roderick's address is: ![]()